 United Kingdom
 United States
 Asia Pacific
Travel Trends for Summer Vacation 2024 (July 15 to August 31)
JTB has summarized the outlook for travel trends among people planning overnight or longer travel during summer vacation (July 15 to August 31, 2024). This report is a compilation of data about overnight or multiple-night travel made by Japanese travelers estimated based on various economic trends, consumer behavior surveys, transportation and tourism-related data, and surveys conducted by the JTB Group. The survey has been conducted on an ongoing basis since 1969.
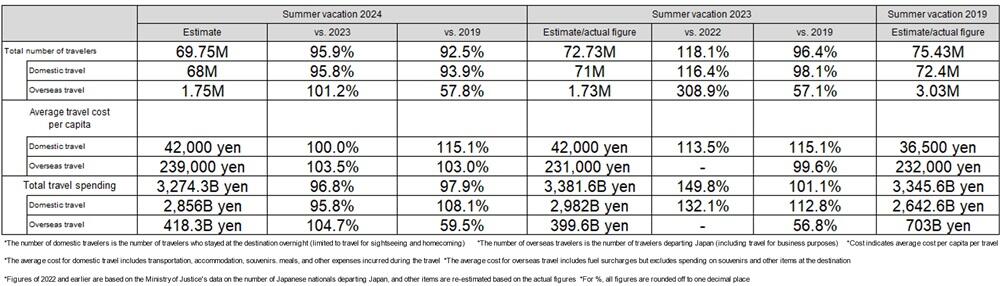
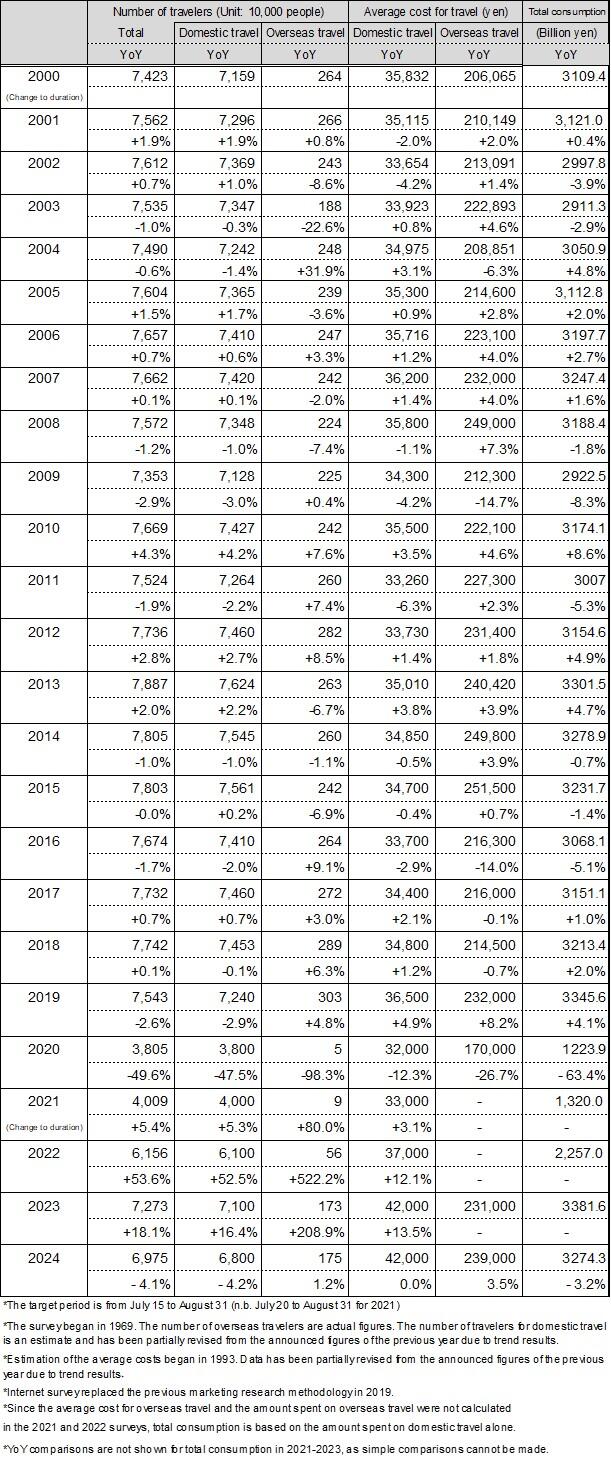
●The total number of travelers during summer vacation is 69.75 million (95.9% year-on-year).
Total travel expense is expected to be 3.2743 trillion yen (96.8% year-on-year).
●The number of domestic travelers is estimated at 68.0 million (95.8% year-on-year), the average cost for domestic travel at 42,000 yen (100.0% year-on-year), and the total domestic travel spending at 2.8560 trillion yen (95.8% year-on-year).
●The estimated number of overseas travelers is 1.75 million (101.2% year-on-year). The average cost of overseas travel is estimated at 239,000 yen (103.5% year-on-year). The estimated value of overseas travel consumption is 418.3 billion yen (104.7% year-on-year).
[Domestic Travel]
➢The number of domestic travelers is expected to slightly decrease from the previous year since travel intentions, which had increased due to the convergence of COVID-19, settled down to a certain degree in addition to uncertainty of the future even though present household circumstances have gradually trended upward.
➢Travel expenses on average (per capita) increased since overall prices are on the rise due to price hikes, but partly because of creative measures such as shorter travel days and destination changes (Figure 25), travel expenses have tended to be suppressed, which leads to an expectation for the same level of travel expenses as the previous year.
➢Destinations appear to be split between intra-regional travel and neighboring prefectures of the travelers’ residence. Compared to the previous year, “Kanto” and “Kinki” are more popular destinations in each region and travel with children also appears to be recovering.
[Overseas Travel]
➢The number of overseas travelers is expected to slightly increase from the previous year despite the impact of the weak yen and price hikes and recover to the pre-pandemic level of 65%.
➢Travel cost on average (per capita) increased since last year partly because of the trend of longer travel and further destinations in addition to the weak yen and price hikes.
➢Short trips primarily to Asia continue to be popular, but travel intention for longer periods and more distant destinations such as Europe slightly recovered. Moreover, there is a trend of selecting destinations that are not overly affected by the weak yen.
(Figure 1) Estimated number of travelers and cost for summer vacation 2024
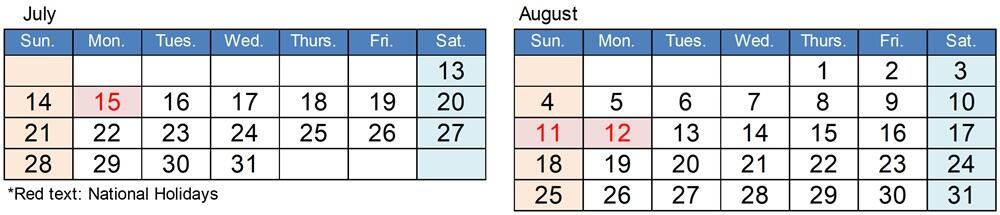
1.Calendar for Summer 2024 (July 15 to August 31) and Travel Trends
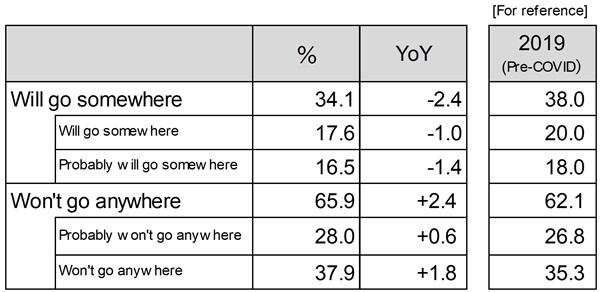
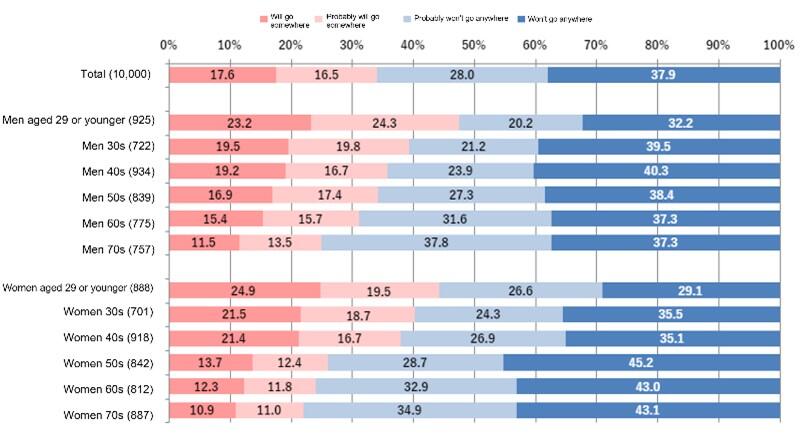
The survey mentioned earlier was designed to capture detailed findings on travel intentions, including homecoming trips, for summer vacation 2024 (departure from July 15 to August 31). Regarding travel intention during summer vacation, the findings of the survey mentioned earlier indicated that 34.1% of the respondents said they would (a combined score of those who will/probably will go somewhere), a decrease of 2.4 points compared with the previous year (Figure 2). Since 2021 during the pandemic when the score in the survey was 19.8%, the intention increased year by year (36.1% in 2022 and 36.5% in 2023) and was even closer to the pre-pandemic year of 2019 (38.0%). However, this year’s survey shows a decline.
By gender and age group, the younger the age group, the higher the travel intention for both men and women. However, the combined scores of those who will/probably will go somewhere were down among all age groups except for women in their 40s. Compared to the previous year, scores were 47.6% for men aged 29 or younger, down by 3.3 points, 44.4% for women aged 29 or younger, down by 3.1 points, 31.1% among men in their 60s, down by 3.9 points, 24.1% among women in their 60s, down by 3.1 points, 25.0% among men in their 70s, down by 4.7 points, and 22.0% among women in their 70s, down by 3.2 points. Meanwhile, the score was 38.0% for women in their 40s, up by 3.7 points. In addition, the decreasing gap from the previous year was the largest for men in their 30s with a score of 39.3%, down by 6.1 points (Figure 3).
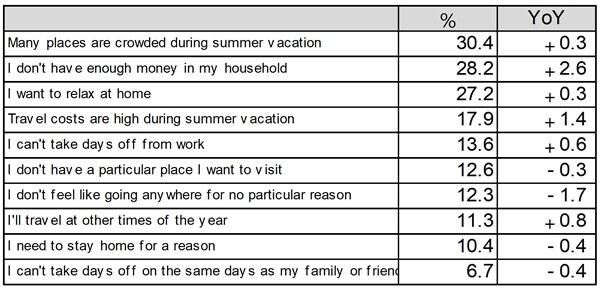
As reasons for having no intention to travel during summer vacation, the most common response was “Many places are crowded during summer vacation” (30.4%), followed by “I don’t have enough money in my household” (28.2%) and “I want to relax at home” (27.2%) among those who have no plans to travel (Figure 4).
(Figure 2) Travel intention during summer vacation
(Single answer, number of respondents =10,000)
(Figure 3) Travel intention during summer vacation
(By gender and age group, single answer, number of respondents=10,000)
(Figure 4) Reasons for having no intention to travel during summer vacation this year
(Multiple answers, number of respondents=6,588)
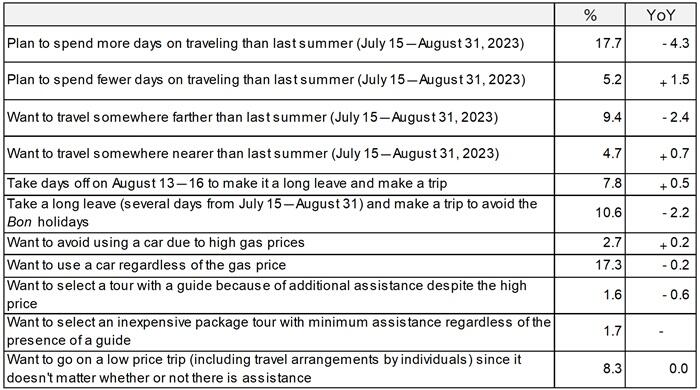
The 2,060 respondents for the preliminary survey who said they will/probably will travel during summer vacation in the screener were asked about their thoughts on travel for this summer vacation. “Plan to spend more days on traveling than last summer” was 17.7%, far outperforming “Plan to spend fewer days on traveling than last summer” (5.2%). However, compared to the previous year, those answering, “Plan to spend more days on traveling than last summer” declined and those who answered “Plan to spend fewer days on traveling than last summer” increased, which indicates the trend of shorter trips. In addition, “Want to travel somewhere farther than last summer” was selected by 9.4% of respondents, which exceeded the number of respondents answering, “Want to travel somewhere nearer than last summer” (4.7%) by 4.7 points. However, compared to the previous year, those who answered, “Want to travel somewhere farther than last summer” decreased while those who selected, “Want to travel somewhere nearer than last summer” increased. This change indicates the trend that relatively nearby destinations are more popular. Regarding travel cost related items, the answer, “Want to use a car regardless of the gas price” (17.3%) was selected much more than the answer, “Want to avoid using a car due to high gas prices” (2.7%), while in terms of assisted travel, more respondents are seeking low price travel without assistance rather than travel with assistance (Figure 5).
(Figure 5) Thoughts on travel for this summer vacation
(Multiple answers, number of respondents=2,060)
2.Domestic Travel Trends
The number of domestic travelers is estimated at 68.0 million (95.8% year-on-year), the average cost for domestic travel per capita at 42,000 yen (100.0% year-on-year), and the total domestic travel spending at 2.8560 trillion yen (95.8% year-on-year) (Figure 1).
Travel trends were analyzed specifically for 1,923 respondents who selected “In Japan” as their travel destination in the survey regarding this year’s summer vacation travel, among all main survey respondents (2,060).
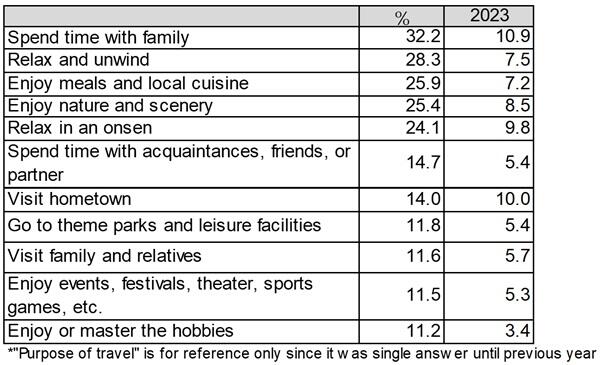
Purpose of travel: (*Changed to multiple answers from this year from single answer until the previous year) “Spend time with family” (32.2%) had the highest rating, followed by “Relax and unwind” (28.3%), and “Enjoy meals and local cuisine” (25.9%) (Figure 6).
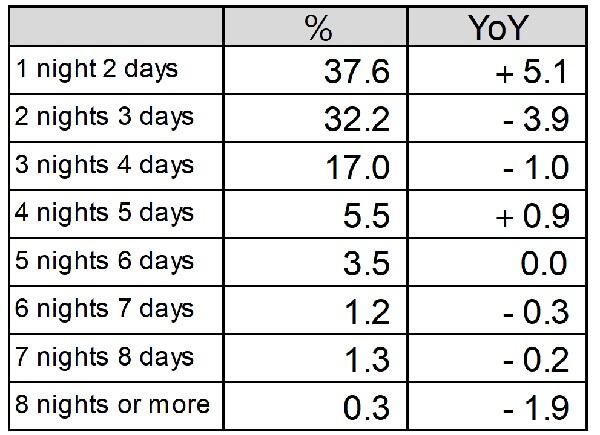
Travel duration (days): On an all-respondent basis, “1 night 2 days” (37.6%) was the most common choice, up 5.1 points from the previous year. “2 nights 3 days” (32.2%) was down by 3.9 points, and “3 nights 4 days” (17.0%) down by 1.0 point from the previous year. Trips of five nights or longer decreased, and overall, it can be said that the travel duration is relatively shorter than the previous year (Figure 7).
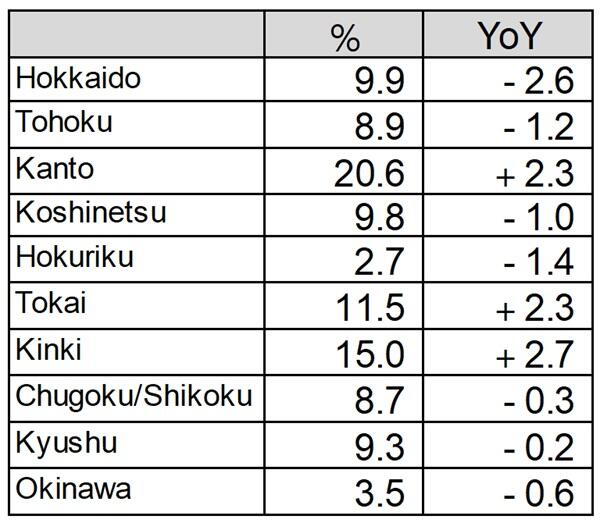
Travel destinations: “Kanto” (20.6%) was the most popular destination, followed by “Kinki” (15.0%) and “Tokai” (11.5%). While all these destinations increased, other destinations decreased (Figure 8).
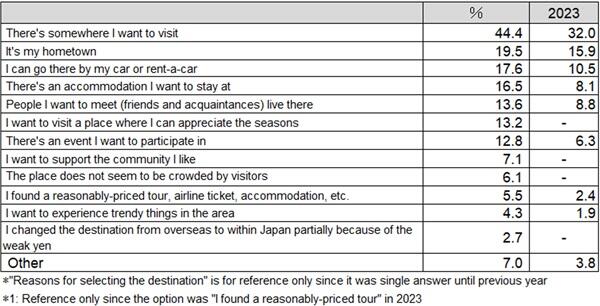
The most common reason for selecting that destination (*changed to multiple answers from this year from single answer until the previous year) was “There’s somewhere I want to visit” (44.4%), followed by “It’s my hometown”(19.5%), “I can go there by my car or rent-a-car” (17.6%) (Figure 9).
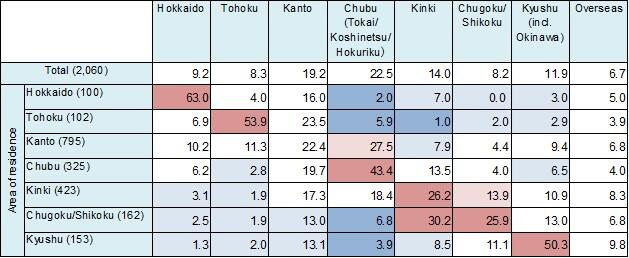
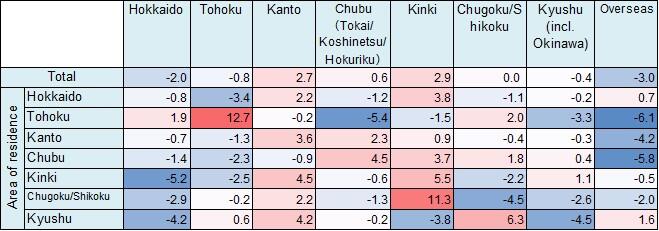
Looking at travel destinations by place of residence, scores for intra-regional travel, i.e., destinations and places of residence are the same, exceed 50% in three regions, namely, “Hokkaido” (63.0%), “Tohoku” (53.9%), and “Kyushu” (50.3%). On the other hand, 22.4% of the respondents living in the Kanto selected “Kanto” while 27.5% chose “Chubu.” Meanwhile, 25.9% of respondents living in the Chugoku/Shikoku selected “Chugoku/Shikoku” and 30.2% selected “Kinki.” The trend indicates popularity is divided into intra-regional travel and travel to neighboring destinations (Figure 10). Compared to the previous year, the percentages of intra-regional travel dropped from the previous year in Hokkaido, Chugoku/Shikoku, and Kyushu, while the percentages of intra-regional travel increased in Tohoku, Kanto, Chubu, and Kinki, indicating different characteristics depending on the region (Figures 11).
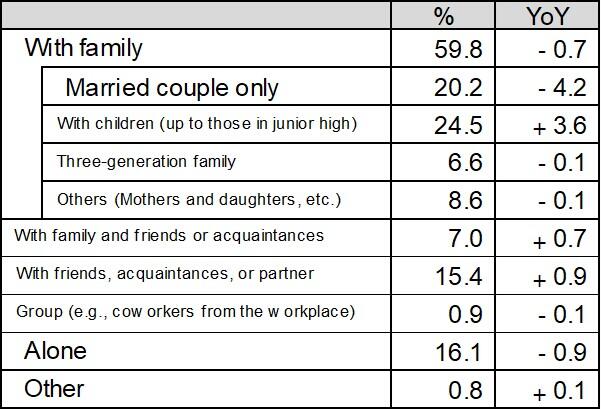
Travel companions: “Family travel with children (up to those in junior high)” (24.5%) had the highest score, up 3.6 points from the previous year, followed by “Married couple only” (20.2%), down by 4.2 points from the previous year. Meanwhile, the scores were up for “With friends, acquaintances, or partner” (15.4%), up 0.9 points, and “With family and friends or acquaintances” (7.0%), up 0.7 points. These figures indicate the trend that travel in a larger group with close friends other than family members is more popular compared to the previous year when the COVID-19’s status under the Act on the Prevention of Infectious Diseases and Medical Care for Patients Suffering Infectious Diseases was shifted to Class V (Figure 12).
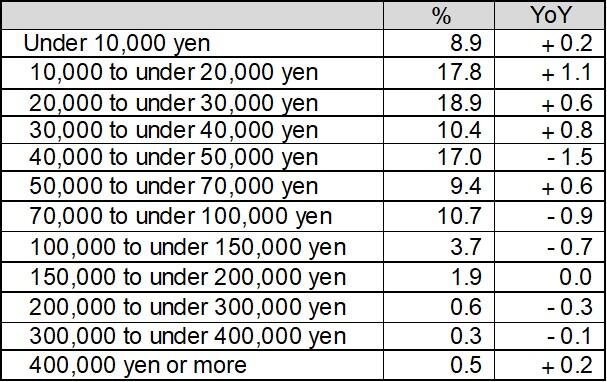
Travel cost per capita: The most common answer was “20,000 to under 30,000 yen” (18.9%), up 0.6 points from the previous year, followed by “10,000 to under 20,000 yen” (17.8%), up 1.1 point from the previous year. The total score of 40,000 yen or more was down 2.7 points from the previous year (Figure 13).
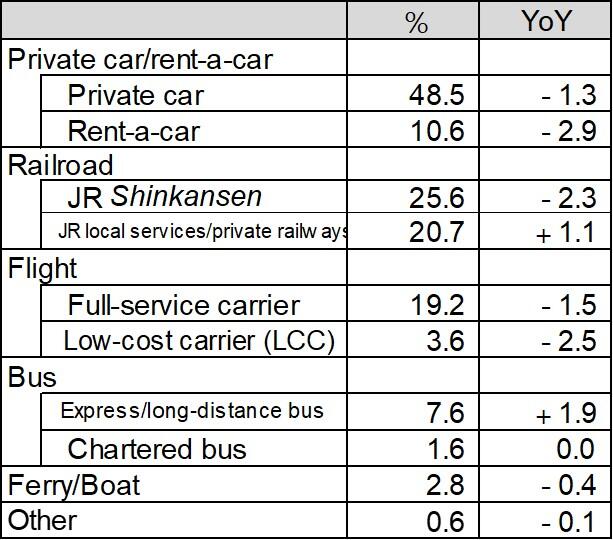
Transportation used: “Private car” (48.5%) was the most popular, followed by “JR Shinkansen” (25.6%) and “JR local services/private railways” (20.7%). Compared to the previous year, “Private car/rent-a-car,” “JR Shinkansen,” and “Flight” decreased, while “JR local services/private railways” increased by 1.1 point and “Express/long-distance bus” (7.6%) increased by 1.9 points (Figure 14).
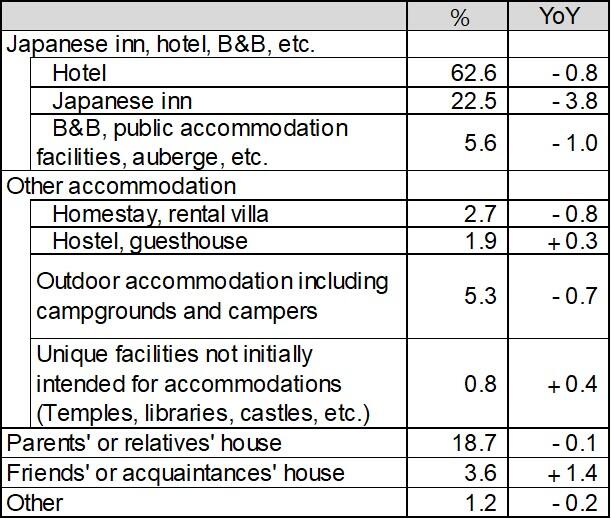
Accommodations used: “Hotel” (62.6%) had the highest score, followed by “Japanese inn” (22.5%) and “Parents’ or relatives’ house” (18.7%). Although the parameter is small, “Friends’ or acquaintances’ house” (3.6%) increased by 1.4 points and “Hostel, guesthouse” (1.9%) and “Unique facilities not initially intended for accommodations” (0.8%) also increased respectively (Figure 15).
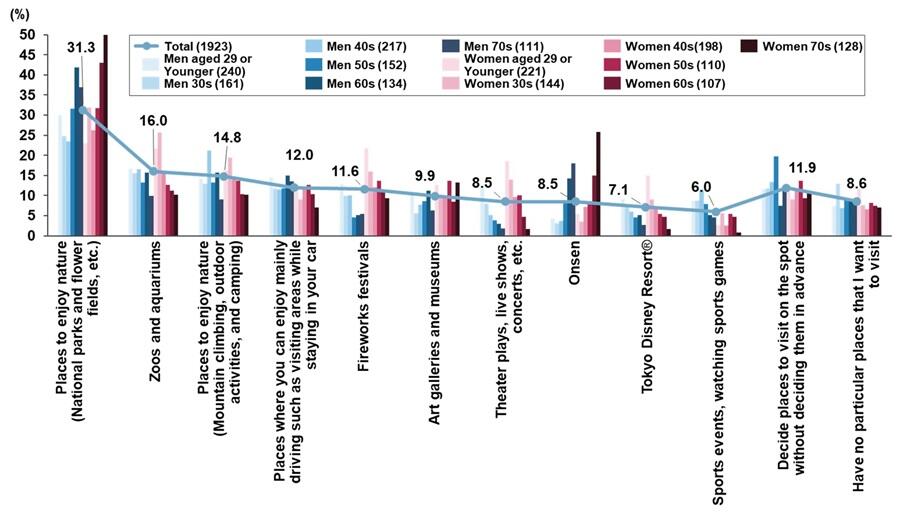
“Places to enjoy nature (National parks and flower fields, etc.)” (31.3%) was cited most often as interesting destinations in mind, followed by “Zoos and aquariums” (16.0%) (Figure 16).
JTB’s reservations for accommodation and domestic packaged products achieved 100% year-on-year growth (total number of travelers, as of July 3). By region, for departure from metropolitan areas, Hokuriku where the Hokuriku Shinkansen was extended to Tsuruga in March, Izu/Hakone, and Chubu are popular. In case of departing from Chubu, Kita Kanto, Tokai, and Shinshu are popular destinations, and in particular, Ghibli Park, where the new “Valley of Witches” opened last March, was popular. For departure from Kansai, Tokyo and Kyushu are also popular destinations in addition to their popularity in intra-regional travel.
(Figure 6) Purpose of travel
(Multiple answers)
(Figure 7) Travel duration (days)
(Single answer)
(Figure 8) Travel destinations
(Single answer)
(Figure 9) Reasons for selecting the destination
(Multiple answers)
(Figure 10) Summer vacation destinations by place of residence
(By area, single answer, number of respondents=2,060)
(Figure 11) Year-on-year changes in summer vacation destinations by place of residence
(By area, single answer, number of respondents=2,060)
(Figure 12) Travel companions (Single answer)
(Figure 13) Travel cost per capita (Single answer)
(Figure 14) Transportation used (Multiple answers)
(Figure 15) Accommodations used (Multiple answers)
(Figure16) Types of interesting places to visit during this summer vacation
(By gender, age group, multiple answers)
*Number of respondents for Figures 6 to 9 and Figures 12 to 16 are 1,923, respectively.
3.Overseas Travel Trends
The estimated number of overseas travelers is 1.75 million (101.2% year-on-year and 57.8% vs. 2019). The number of overseas travelers from 2010 to 2019 transitioned around 2.67 million people every year, and compared to this figure, the number of overseas travelers has recovered to approximately the 65% level. The average cost of overseas travel is estimated at 239,000 yen (103.5% year-on-year). The estimated value of overseas travel consumption is 418.3 billion yen (104.7% year-on-year). Specific trends will be described in the following chapters.
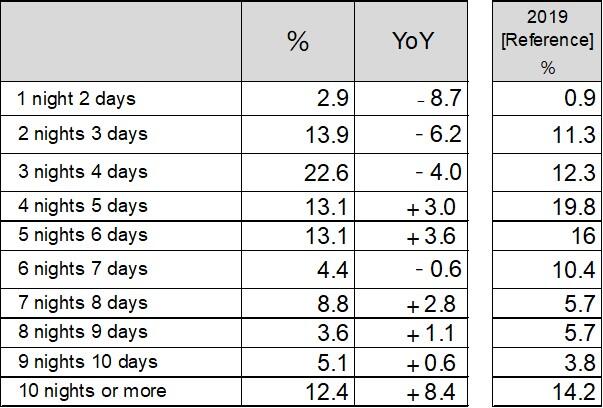
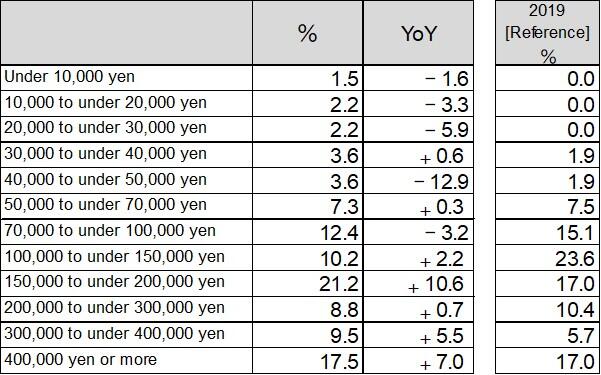
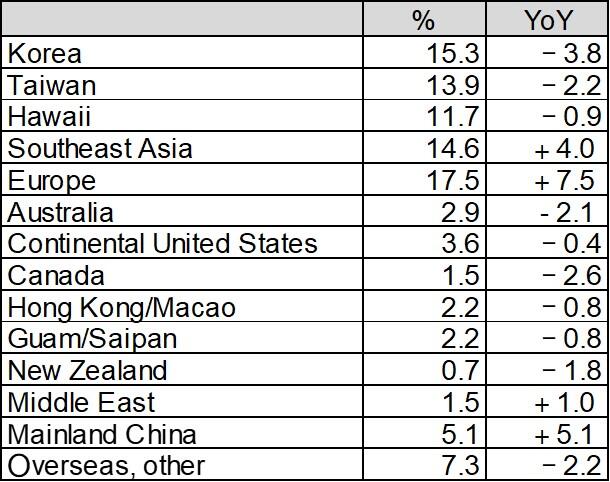
Of the 2,060 main survey respondents, 137 (6.7%) selected “Overseas” as their summer vacation destination this year. “3 nights 4 days” (22.6%) was the most common travel duration (days), down by 4.0 points from the previous year, followed by “2 nights 3 days” (13.9%), down by 6.2% (Figure 17). The most common travel cost was “150,000 to under 200,000 yen” (21.2%), followed by “400,000 yen or more” (17.5%) (Figure 18). The top destinations were “Europe” (17.5%), “Korea” (15.3%), and “Southeast Asia” (14.6%) (Figure 18). The reason why Europe is the popular destination is partially because of the impact from the Paris 2024 Olympic and Paralympic Games (Figure 19).
JTB’s reservations for overseas travel achieved 130% year-on-year growth (total number of travelers, as of July 3). Popular destinations are “Hawaii” and Asia such as “Korea,” “Singapore,” and “Taiwan.” Europe made a significant recovery from the previous year while Singapore and Bali, which are slightly farther destinations in Asian countries and Australia also recovered. For specific tours, tours to the West Coast of the US with official MLBTM game tickets are popular.
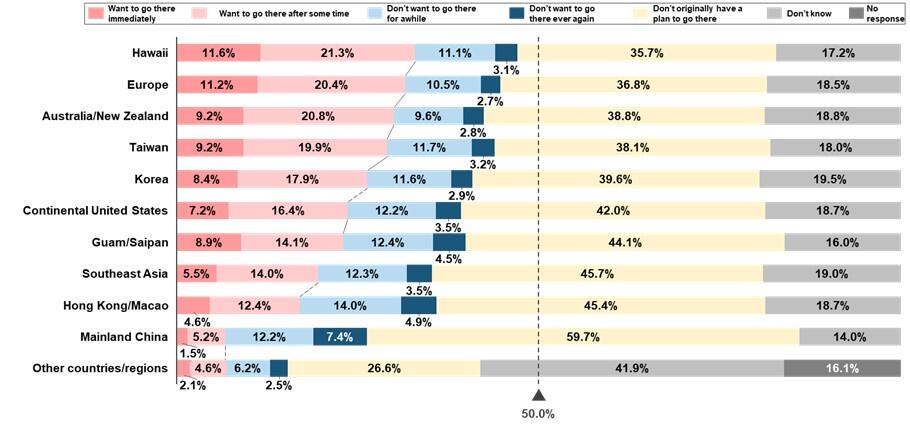
We also asked all screener respondents, including those who will not be traveling during this summer vacation, about their intentions for future overseas travel. Looking at the timing of overseas travel by destination, “Hawaii” (11.6%) had the highest score for “Want to go there immediately,” followed by “Europe” (11.2%) and “Australia/New Zealand” (9.2%) (Figure 20).
(Figure 17) Travel duration (days)
(Single answer)
(Figure 18) Travel cost per capita
(Single answer)
(Figure 19) Travel destinations
(Single answer)
(Figure 20) The intention for future international travel by destination
(Single answer, number of respondents=10,000* All screener respondents)
*Number of respondents for Figures 17 to 19 are 137, respectively.
4.Economic Environment Surrounding Travel and Leisure Consumption and Consumers Mindset
In the Japanese economy, the unstable international context, trend of price hikes in Japan and overseas, and weak yen in the currency exchange market continue. Despite the Nikkei Index rising to 40,000 yen in March 2024 and early July 2024, the Nikkei Index has been hovering and seesawing at around the 35,000 yen to less than the 40,000 level. The Japanese government offered the assessment in its Monthly Economic Report for June 2024, “The Japanese economy is recovering at a moderate pace, although it recently appears to be pausing” which remains the same for the fifth consecutive month, and the report also states that private consumption “appears to be pausing for pick up” for the fifth consecutive month. This situation indicates that the recovery of the economy is very gradual. In addition, the report summarizes the economic prospects as follows: “the economy is expected to continue recovering at a moderate pace with the improving employment and income situation. However, slowing down of overseas economies is downside risk of the Japanese economy, and full attention should be also given to price increases, the situation in the Middle East, and fluctuations in the financial and capital markets. In addition, full attention should be given to the economic impact of the 2024 Noto Peninsula Earthquake.”
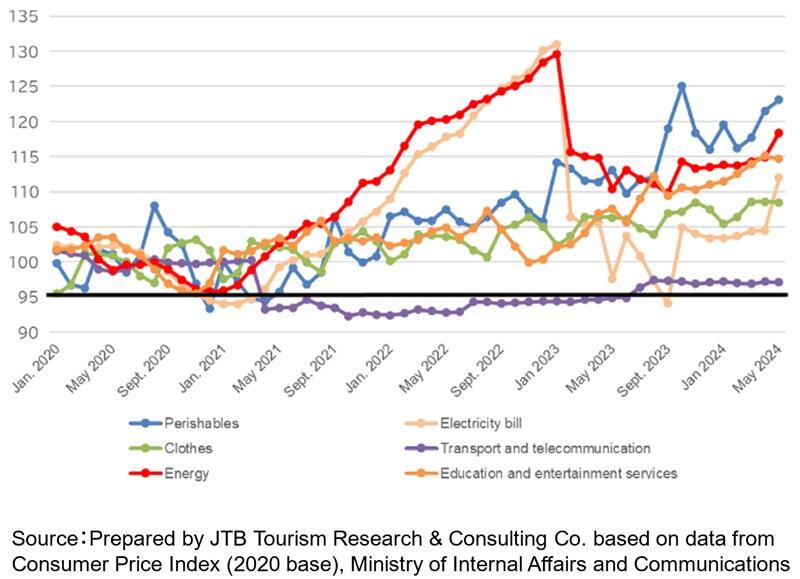
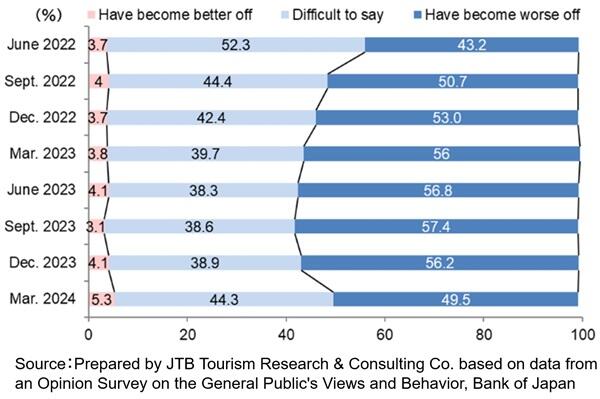
Looking at consumer price indexes for major items, a continued upward trend is observed, and except for “Transport and telecommunication” costs, all the prices are also on the rise. Even “Transport and telecommunication” costs have remained flat for these several months, indicating a significant impact on daily life (Figure 21). On the other hand, according to the “Impression of Present Household Circumstances” section of the Bank of Japan’s “Opinion Survey on the General Public’s Views and Behavior,” since December 2023, the proportion of respondents who said they “Have become better off” increased while fewer respondents selected “Have become worse off,” indicating the daily lifestyle situation is slightly improving amidst the rising prices (Figure 22).
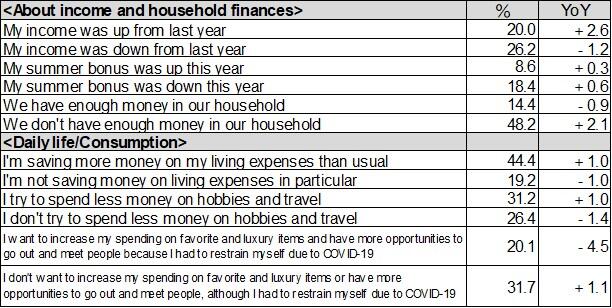
Respondents were also asked about their life and travel for this summer. As a result, “My income was up from last year” (20.0%) increased from the previous year, and fewer respondents selected “My income was down from last year” (26.2%) compared to the previous year, indicating an improving trend in terms of income. On the other hand, the number of respondents answering, “We don’t have enough money in our household” (48.2%) increased year-on-year, while the number of those who selected “We have enough money in our household” (14.4%) decreased. The result shows the ongoing difficult situation could be because of the aforementioned economic situation of Japan. This situation is believed to be affecting consumption as well, and the answers, “I’m saving more money on my living expenses than usual” (44.4%), “I try to spend less money on hobbies and travel” (31.2%), and “I don’t want to increase my spending on favorite and luxury items or have more opportunities to go out and meet people, although I had to restrain myself due to COVID-19” (31.7%) increased from the previous year, and the answers, “I’m not saving money on living expenses in particular” (19.2%), “I don’t try to spend less money on hobbies and travel” (26.4%), and “I want to increase my spending on favorite and luxury items and have more opportunities to go out and meet people because I had to restrain myself due to COVID-19” (20.1%) respectively decreased (Figure 23).
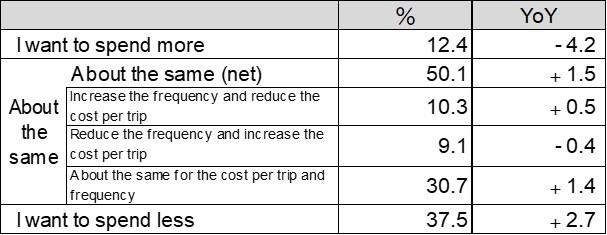
Regarding the “Spending intention on travel in the next year,” the number of respondents who selected, “I want to spend less” (37.5%) increased from the previous year while those answering, “I want to spend more” (12.4%) decreased. These results indicate the trend of holding down travel expenses (Figure 24).
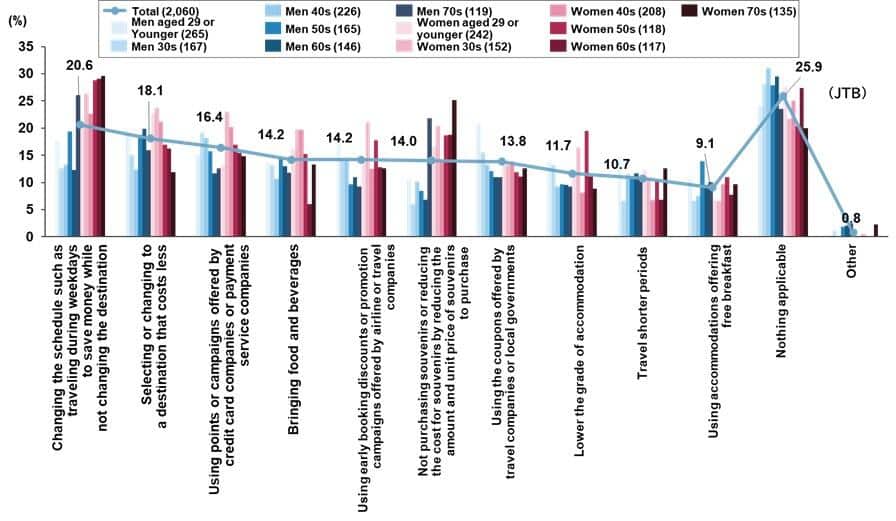
Finally, the main survey respondents who answered they will/probably will travel during summer vacation were asked about measures for managing to raise funds for recent trips (domestic/overseas) (including travel during summer vacation). Except for the answer, “Nothing applicable” (25.9%), the most popular option was “Changing the schedule such as traveling during weekdays to save money while not changing the destination” (20.6%), followed by “Selecting or changing to a destination that costs less” (18.1%), “Using points or campaigns offered by credit card companies or payment service companies” (16.4%), and “Bringing food and beverages” (14.2%). A wide variety of measures from reviewing travel schedules and destinations to point use, bringing food and beverages, and purchasing souvenirs are taken, and this trend is particularly noticeable among women (Figure 25).
(Figure 21) Transition of the consumer price index
(Figure 22) Impression of present household circumstances
(Figure 23) Life and travel for this summer (Multiple answers, number of respondents=10,000)
(Figure 24) Spending intention on travel in the next year (Single answer, number of respondents=10,000)
(Figure 25) Measures for managing to raise funds for recent trips
(Multiple answers, number of respondents =2,060 *Main survey respondents/publication of top answers only)

[Travel Trend Survey: Survey Methodology]
Fieldwork dates: June 11 to 13, 2024
Respondents: Men and women aged 15 to 79 nationwide
Sample size: 10,000 individuals for the screener and 2,060 for the main survey
(The respondents for the main survey were recruited from those who responded they will/probably will travel during summer vacation in the screener)
Survey focus: Overnight travel or longer planned from July 15 to August 31, 2024
(Domestic travel is limited to sightseeing and homecoming trips; overseas travel includes business trips)
Survey methodology: Online survey
*The numerical figures in the survey results do not match some of the subtotals and the differences from the figures in the previous year are due to rounding off the numerical figures in the survey results.
(Figure 26) Transitions of estimated figures for travel trend in summer vacation
Learn more about JTB Global Marketing & Travel


Exploring Brooklands Museum with Alex Patterson

Global Tourism Challenges and Upcoming Events: A Conversation with Don Welsh

Peebles Barbeque: A Legacy of Flavor and Tradition

Exploring Bok Tower Gardens with Erica Smith

Rue’s Living Water Boat Cruises: Exploring Winter Haven’s Chain of Lakes

Durango and Silverton Railroad: A Timeless Journey Through History and Scenic Beauty

Walt Leger on New Orleans’ Resilience and Major Events Ahead

Cindy Mackin Shares Estes Park’s Winter Thrills

Mark Jaronski of Explore Georgia on FIFA World Cup 2026

Connecting Small Businesses to Global Tourism Markets: Nate Huff of Tourism Exchange

North Carolina’s Resilience: Wit Tuttell on Recovery and Tourism

Kittipong Prapattong’s Plan for Thailand’s Tourism Growth: Taxes, Visas, and Campaigns

Our emails to you has bounced travelmole.com Or You can change your email from your profile Setting Section
Your region selection will be saved in your cookie for future visits. Please enable your cookie for TravelMole.com so this dialog box will not come up again.
Price Based Country test mode enabled for testing United States (US). You should do tests on private browsing mode. Browse in private with Firefox, Chrome and Safari


CLIA expands trade support with expedition event
Qatar Airways adding Manchester flights
Jet2 unveils Samos as new Greek destination for summer 2026
EU entry-exit system delayed again
ATC strike in Greece could disrupt flights this week